Outputs & exports
Sensitivity
Two assumptions on the axes, one metric in the cells, a full engine run behind each.
Sensitivity (left nav; no digit shortcut — ⌘K gets you there) answers “how wrong can I be”: pick an X-axis variable, a Y-axis variable, and a metric, and read the grid.
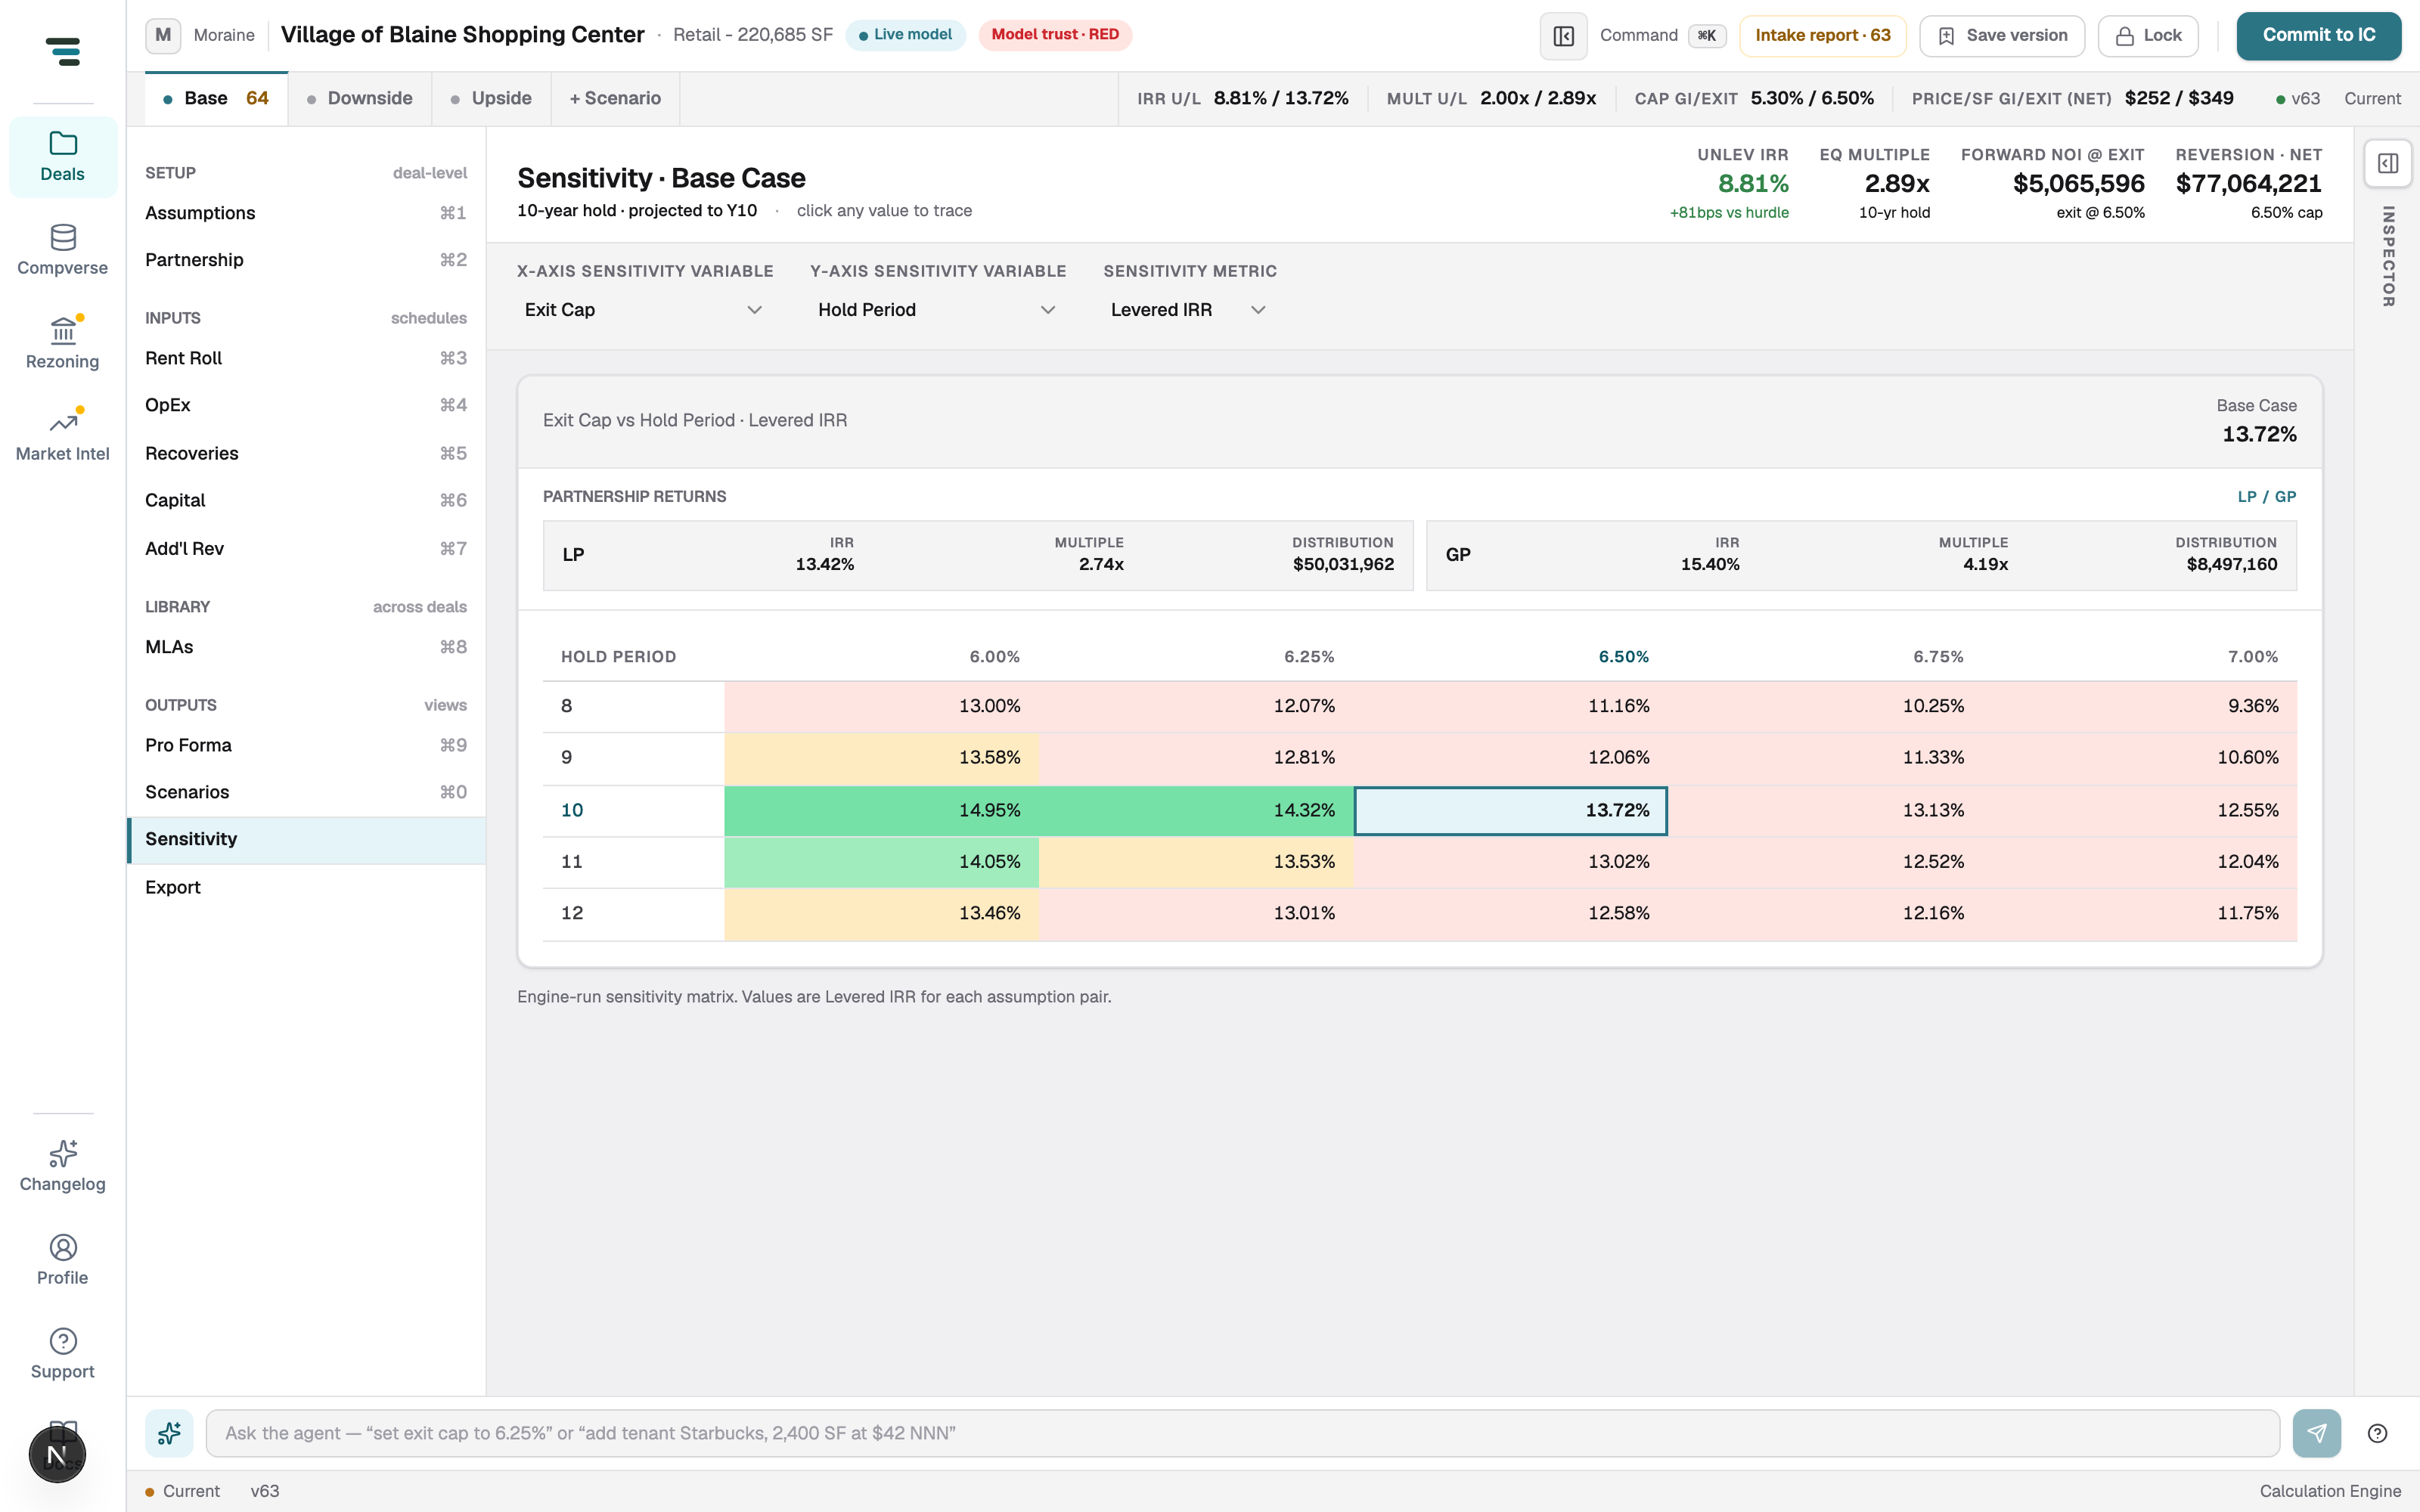
Every cell is a complete engine run at that assumption pair — not an interpolation — so the grid is also a robustness check: a base case sitting on a color cliff is the finding.
With the waterfall enabled, the Partnership returns strip above the grid shows LP and GP IRR/multiple/distribution, with an LP / GP toggle for whose returns the matrix shows.